Website loading time: what’s good, why it matters, and how to fix yours
What counts as a good website loading time — and what to do when yours falls short. We break down the three Core Web Vitals metrics, explain why they matter commercially, and share platform-specific fixes for WordPress and Shopify.
The gateway question — what counts as a good website loading time, why it matters commercially, and the practical fixes that actually move the needle on WordPress and Shopify.
If you’ve ever wondered whether your site is genuinely slow or just feels that way, you’re in the right place. Website loading time is the single most tangible measure of how your site performs — and it affects everything from search rankings to whether a visitor sticks around long enough to pick up the phone.
This post is part of our broader guide to website performance for UK small businesses. Below, we break down what “good” actually means in measurable terms, why it matters commercially, and the platform-specific fixes that move the needle on WordPress and Shopify.
What counts as a good website loading time
A good website loading time means a Largest Contentful Paint (LCP) under 2.5 seconds, an Interaction to Next Paint (INP) under 200 milliseconds, and a Cumulative Layout Shift (CLS) below 0.1.
Those three numbers map to Google’s Core Web Vitals — the metrics that define whether a page feels fast, stable, and responsive:
| Metric | What it measures | Good threshold |
|---|---|---|
| Largest Contentful Paint (LCP) | How quickly the main content renders | ≤ 2.5 seconds |
| Interaction to Next Paint (INP) | How fast the page responds to taps and clicks | ≤ 200 ms |
| Cumulative Layout Shift (CLS) | How much the layout jumps around unexpectedly | ≤ 0.1 |
Google assesses these at the 75th percentile of real-user visits — meaning three out of four visitors need to hit the “good” threshold, not just the average.
Why loading time matters commercially
53% of mobile visits are abandoned if a page takes longer than three seconds to load. Every additional second of page load time costs roughly 10% of your audience. For a small business relying on contact form submissions or online sales, that’s revenue walking out the door before anyone’s seen your offer.
[STAT NEEDED: Deloitte study showing 0.1s improvement = up to 10.1% conversion uplift — referenced in brief but not found in research sources]
Core Web Vitals also play a role in how Google ranks your pages. Two sites with similar content competing for the same keyword? The faster one gets the edge. For SMEs competing against larger brands, speed is one of the few ranking factors you can control directly without a bigger budget.
The three metrics that actually matter
Largest Contentful Paint (LCP)
LCP measures how quickly the biggest visible element — usually a hero image, heading, or product photo — appears on screen. It’s the metric most sites struggle with: 40% of websites fail the 2.5-second threshold. On mobile, 73% of pages have an image as their LCP element, so image delivery dominates the story.
The surprising part? Downloading the image itself is rarely the bottleneck. The median site with poor LCP wastes 1,290 milliseconds before even starting the image download — more than half the 2.5-second budget gone before anything useful happens.
Interaction to Next Paint (INP)
INP replaced First Input Delay as a Core Web Vital on 12 March 2024 and raised the bar significantly. Where FID only measured the delay on your very first interaction, INP captures the worst interaction across your entire visit — every tap, click, and keypress.
Only 65% of mobile sites pass INP, compared to 93% that passed the old FID metric. The main culprit is JavaScript blocking the browser’s main thread, preventing it from responding to your interactions.
Cumulative Layout Shift (CLS)
CLS measures unexpected visual movement — buttons shifting as you reach for them, text jumping after an image loads. The single biggest cause is images without explicit width and height attributes. Without dimensions, the browser starts an image at zero pixels tall and shoves everything down once it loads. A staggering 66% of pages have at least one unsized image.
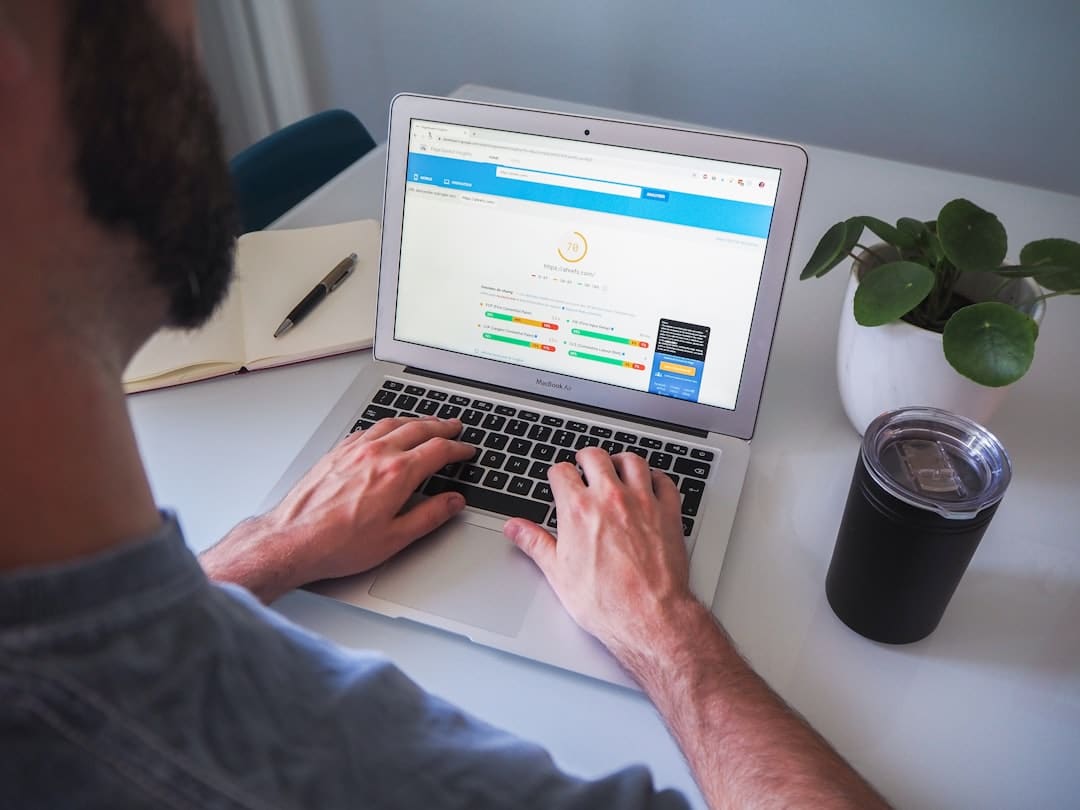
How to measure loading time properly
Lab data and field data tell different stories. Lab tools like Lighthouse and WebPageTest run tests under controlled conditions — useful for diagnosing problems, but they don’t reflect what real visitors experience.
What Google actually uses for ranking signals is CrUX (Chrome User Experience Report) — a 28-day rolling window of measurements from real Chrome users visiting your site. You can access this data through:
- PageSpeed Insights — enter your URL for a quick field-data snapshot
- Google Search Console — the Core Web Vitals report shows pass/fail status across your entire site
- Chrome UX Report — the raw dataset for deeper analysis
Your Lighthouse score might be 95, but if your CrUX data shows poor LCP, Google sees a slow site. Field data is what counts.
Why your site might be slow
WordPress
WordPress sites pass all three Core Web Vitals at a rate of roughly 43%, well below the web average of 48%. The platform itself isn’t the problem — it’s how most sites are built on it.
Plugin bloat is the biggest offender. Page-builder themes load CSS and JavaScript for features you’re not using on the current page. Every plugin can inject its own scripts globally. WordPress also loads unnecessary defaults — an emoji script, Dashicons for logged-out visitors — all competing for the main thread.
Slow hosting is the other major factor. Without caching, every page request requires PHP execution and database queries. WordPress’s TTFB pass rate sits at roughly 32%.
Externally loaded Google Fonts create two extra connections, adding 100–500 ms to the critical path. Self-hosting your fonts eliminates those lookups entirely.
Shopify
Shopify’s infrastructure is a genuine strength — hosted CDN, automatic WebP conversion, and fast server response times give it an overall CWV pass rate of around 75%. But LCP is the primary failure point, and apps are almost always the cause.
Stores with 8 or more app scripts show median mobile LCP above 3.0 seconds; stores with three or fewer maintain LCP under 2.0 seconds. One case study found that removing three unused apps reduced total page JavaScript by 380 KB and improved mobile LCP by 1.1 seconds.
Critically, uninstalling a Shopify app does not always remove its code. Orphaned snippets in theme files continue executing until you manually delete them.
The practical fixes that work
Sort your images first. Serve AVIF format where possible — it delivers more than 50% file-size savings over JPEG and roughly 35% over WebP. Use the <picture> element for format negotiation with WebP and JPEG fallbacks. Always set explicit width and height attributes to prevent layout shifts.
Fix your LCP image. Mark it with fetchpriority="high" and loading="eager". Never lazy-load above the fold — WordPress A/B testing showed that lazy-loading above-the-fold images degraded LCP from 2,922 ms to 3,546 ms.
Defer non-critical JavaScript. Every analytics snippet, chat widget, and tracking pixel competes with user interactions for CPU time. Break long tasks into smaller chunks to keep the main thread responsive and INP under 200 ms.
Self-host your fonts in WOFF2. Preload the primary weight and use font-display: optional for zero layout shift from font swaps.
Invest where it counts. For WordPress, that means managed hosting (or at minimum a page-caching plugin plus a CDN). For Shopify, it means fewer but better apps — each additional app measurably degrades LCP and INP.
Perceived vs. actual speed
Objective speed and perceived speed aren’t the same. Jakob Nielsen’s foundational response-time thresholds — validated repeatedly since 1968 — define three critical limits: 0.1 seconds feels instantaneous, 1 second maintains flow of thought, 10 seconds loses attention. These thresholds are rooted in human perception and haven’t changed in over 50 years.
For page loads taking 2–10 seconds, skeleton screens — wireframe-like placeholders that mimic page layout — help users build a mental model of the page before content arrives. Static-content skeletons are the most effective pattern.
There’s also the 20% rule: a performance improvement must exceed 20% for users to notice it. Shaving 0.2 seconds off a 3-second load won’t register. You need meaningful gains — which is why the fixes above focus on the interventions that deliver the biggest jumps.
When to call an agency
If you’ve compressed your images, removed the obvious plugins, and still can’t get past 2.5 seconds on LCP, the problem is usually architectural — hosting infrastructure, theme code, or third-party script conflicts that need a developer’s eye.
That’s what we do. Whether you’re on WordPress and need hosting that actually performs, or running a Shopify store buried under app bloat and need a proper audit and rebuild, we’ll diagnose it properly and quote transparently — no jargon, no retainer lock-in. Start with a discovery call and we’ll tell you honestly what’s fixable and what it’ll cost.
FAQs
Is 3 seconds fast enough?
Not really. Google’s “good” threshold for LCP is 2.5 seconds, and research shows that 53% of mobile users leave after 3 seconds. Aim for under 2.5 seconds — and ideally under 2 seconds for a noticeably better experience.
Does loading time affect SEO?
Yes. Core Web Vitals (LCP, INP, CLS) are a confirmed Google ranking signal. A faster site won’t automatically reach position one, but between two similar pages, the faster one gets the edge.
Why is my Shopify site slow?
Apps. The average Shopify store runs 6–10 third-party apps, each injecting JavaScript onto every page. Stores with 8+ app scripts show median mobile LCP above 3 seconds. Audit your apps, remove what you don’t use, and check for orphaned code from previously uninstalled apps.
How do I test my website’s loading time for free?
Use PageSpeed Insights — it shows both lab scores and real-user field data from Chrome. For site-wide monitoring, check the Core Web Vitals report in Google Search Console. Field data (CrUX) is what Google uses for rankings, not lab-only Lighthouse scores.
Keep reading
Related articles

Web design for small business: the complete guide for UK SMEs
15 June 2026 · 11 min read

Accessible Web Design: A Practical Guide for WordPress and Shopify Sites
15 June 2026 · 6 min read
How to choose a Shopify agency: what UK businesses should ask before hiring
15 June 2026 · 6 min read
Get in touch
Ready to grow your business online?
Skip the forms. Have a real conversation with someone who can actually help.
— or —
24-hour response guarantee
We'll get back to you within one business day, every time.
No hard sell, ever
Just an honest conversation about whether we're the right fit.
Talk to the people who'll do the work
No account managers or middlemen. Meet your actual team.